Google Analytics 4 (GA4) delivers powerful data - but many companies struggle with the overview. This is exactly where Looker Studio comes in: The free Google tool turns your raw data into visually appealing, interactive reports. In 2025, Looker Studio is the central instrument for anyone who not only wants to collect their marketing and web data, but also understand and use it.
In this article, we show you how to prepare GA4 data professionally with Looker Studio - including best practices for clean dashboards, efficient reporting and data-driven decisions.
Why use Looker Studio for GA4 reporting?
GA4 has many strengths - but the integrated reports are often too technical or not customized enough. Looker Studio (formerly Google Data Studio) offers:
- Complete customization: you decide what is displayed - from conversion rates to scroll depths.
- Connect multiple data sources: Combine GA4 with Google Ads, Search Console, CRM data or Social Media Insights.
- Automatic updating & sharing: Reports are updated live and can be easily shared via a link.
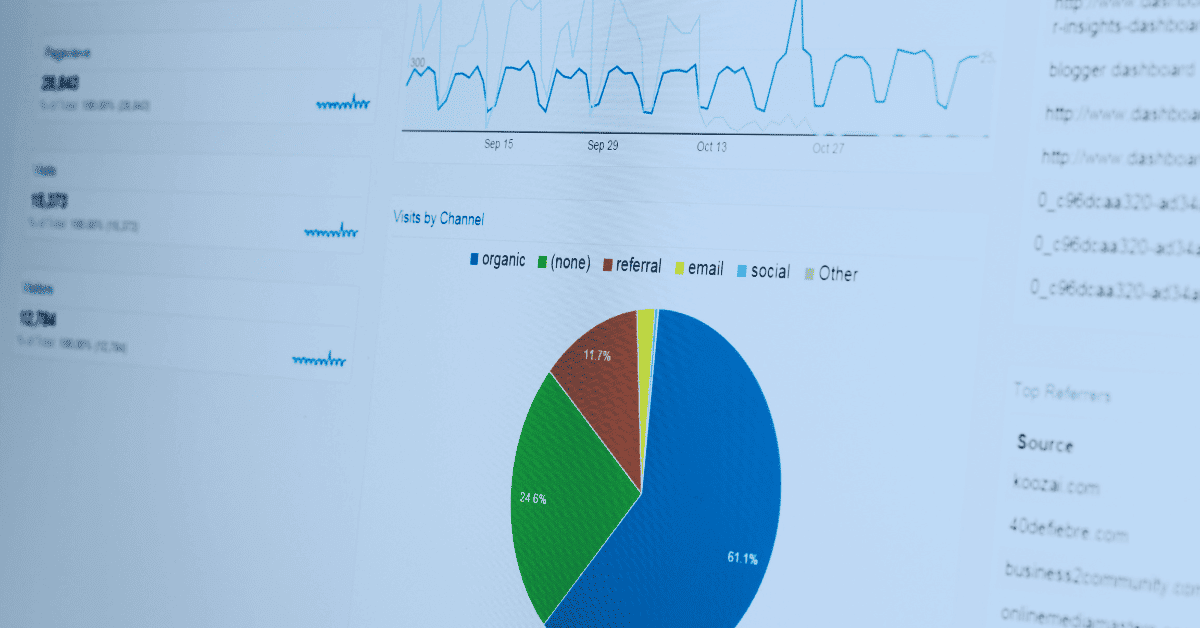
- Clear visualizations: From charts to tables to dynamic filters - understandable for every team member.
Step-by-step: Connect GA4 with Looker Studio
1. open Looker Studio and create a new blank template
2. add Google Analytics data source
- Select GA4
- Select the desired property and data stream
3. define data fields
- Metrics (e.g. users, events, conversions)
- Dimensions (e.g. source/medium, device type, page path)
4. create diagrams & visualizations
- Time curves, bar charts, tables, filter bars
5. design and save dashboard
- Corporate design? No problem with your own colors, fonts & logos
Best practices for reports with Looker Studio (2025)
Less is more: only show the key figures that are actually used - focus before completeness.
✅ Segment instead of filter: Use segments to better understand target groups (e.g. only mobile traffic, new customers, etc.).
✅ Set up automatic email reports: Send dashboards regularly to stakeholders as PDFs.
✅ Visualize custom events and conversions: What is tracked in GA4 should also be visible in the dashboard.
✅ Pay attention to performance: Filter and aggregate large data sets - otherwise the dashboard will be slow.
Typical errors and how to avoid them
❌ Unclear reports with too many figures
➡️ Clear structure, simple navigation, logical groupings create orientation.
❌ Data does not match GA4
➡️ Check the fields used - GA4 calculates differently to Universal Analytics. Define your own metrics if necessary.
❌ Unclear KPIs or target definitions
➡️ Define before creating: What should the report achieve? Who will use it? What decisions should be made with it?
Conclusion: Looker Studio + GA4 = understandable data, better decisions
Looker Studio is the perfect tool for turning GA4 data into concrete learnings. Whether for management, marketing or product - a well-built dashboard makes data-driven decisions in the company visible, measurable and understandable.
Would you like to have your Looker Studio dashboard professionally created or reviewed?
We help with the design, implementation and automation - data-driven, clearly structured and 100% GA4-ready.